
In modern power grids with high-proportion new energy integration, Static Var Generators (SVG)—a core device for enhancing power transmission capacity and stabilizing voltage quality—have raised concerns about system stability post-commissioning. This article, centered on the research content of the aforementioned file, focuses on SVG-induced sub-synchronous resonance (SSR) risks in regional power grids, using transient electromagnetic simulation to conduct an in-depth analysis of SVG modeling, scenario testing, and risk mitigation. It provides actionable insights for the safe application of SVGs, with a focus on key factors like SVG control modes and grid operating conditions, fully aligning with the technical framework and research objectives outlined in the file.
I. Core SVG Modeling for Regional Power Grid Transient Electromagnetic Simulation
Accurate transient electromagnetic modeling is fundamental to analyzing SVG-related SSR risks, as emphasized in the file. The process prioritizes three key aspects: the fidelity of SVG models, the efficiency of photovoltaic (PV) grid-connected unit modeling, and the accuracy of basic power grid parameters—all critical for reliable SSR risk assessment as specified in the file’s research methodology.
1. Power Grid Parameter Verification & SVG Commissioning Background
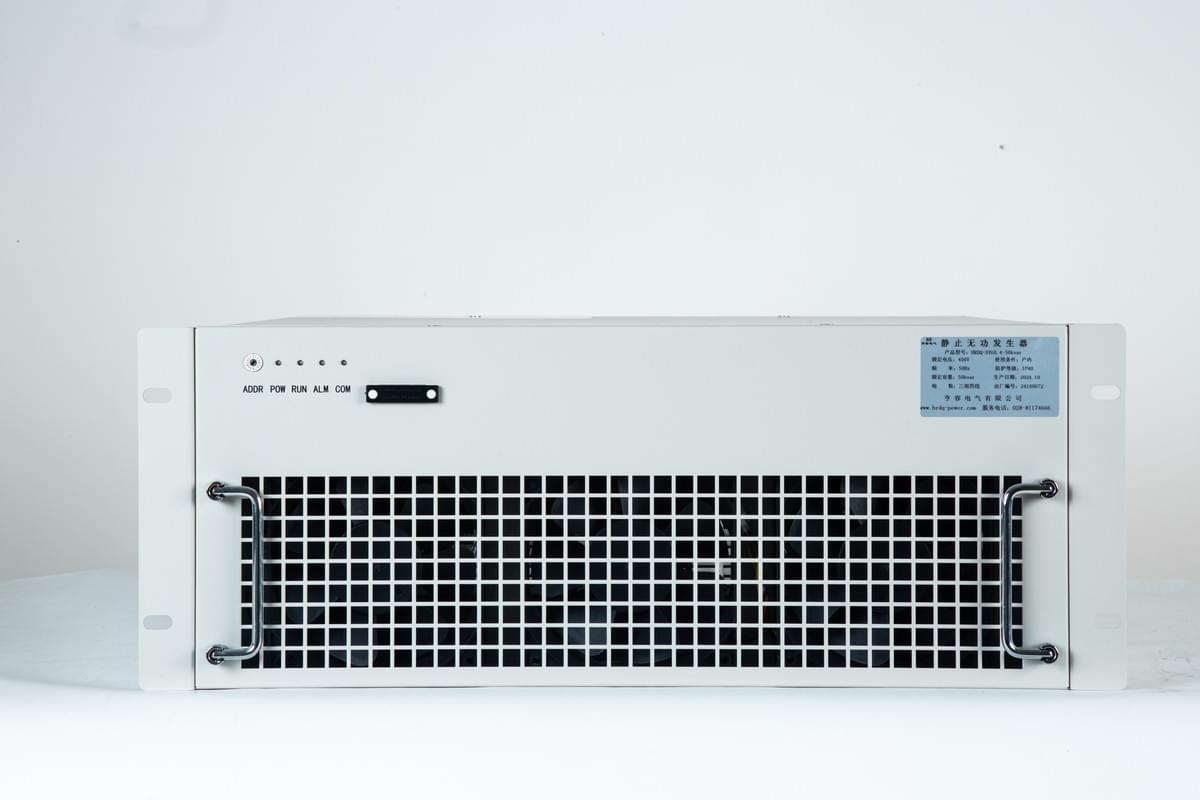
The research team first verified line and main transformer parameters of the regional power grid to eliminate data deviations, laying a solid foundation for modeling, consistent with the file’s requirement for "comprehensive parameter verification to ensure no original data deviations". Context for SVG deployment was clarified: to address winter electric heating load growth and boost power off-take capacity of 750kV/220kV key sections, three sets of ±52Mvar SVGs are planned for the 35kV side of multiple 220kV substations, which directly reflects the SVG commissioning background and technical parameters detailed in the file. The control modes and parameter settings of these SVGs directly influence grid oscillation risks, making them the core focus of modeling, as highlighted in the file.
2. Targeted Modeling of SVG & PV Grid-Connected Units
- SVG Model Development: For the ±52Mvar SVGs, two core control modes—constant reactive power control and constant voltage control—were simulated, with varied parameters (response speed, proportional-integral coefficients) to test their impact on grid stability. Under constant reactive power control, the SVG stabilizes the set reactive output to balance PV fluctuations; under constant voltage control, it adjusts reactive power to maintain grid-connected point voltage. These mode-specific behaviors were accurately reflected in the model to ensure SSR risk relevance, fully adhering to the SVG modeling requirements and control mode analysis specified in the file.
- PV Unit Modeling Optimization: Given the large number of PV plants in the region, switch-device converter modeling was deemed inefficient. Instead, an "equivalent controlled voltage/current source average modeling method" was adopted—exactly the innovative modeling approach proposed in the file. Validation confirmed high fitting degrees between this method and switch-device models across scenarios (e.g., active power command jumps, 0.1s AC-side single-phase ground faults), proving it maintains accuracy while significantly improving simulation efficiency for SVG-integrated grids, which aligns with the file’s verification results and efficiency improvement objectives.
II. SVG-Centered Sub-Synchronous Oscillation Simulation Design
To comprehensively assess SSR risks post-SVG commissioning, simulations were designed around SVG-related variables (control modes, response speed) and grid conditions (PV output, load level), covering both extreme and normal operating scenarios—critical for identifying high-risk conditions as required in the file.
1. High-Risk Scenario Setting for SVG-Induced SSR
Drawing on new energy grid integration experience, grids are most vulnerable to SVG-induced SSR under "fewer synchronous generators, weak grid structure, low PV output, and low load"—conditions that reduce grid anti-disturbance capability, as explicitly stated in the file. Core simulation parameters were set as follows (consistent with the file’s scenario design):
- Hydropower operation: 2 units (minimum mode);
- Load levels: 300,000 kW (small) and 530,000 kW (large);
- PV output: 20% (low, high volatility) and 70% (high, stable);
- SVG settings: constant reactive power/constant voltage control modes (with adjusted response speed);
- Disturbance: 0.1s single-phase grounded fault via impedance on 220kV bus (to trigger potential SSR).
2. Simulation Process & SSR Risk Observation
The system was first stabilized, with SVG and PV outputs reaching steady state. After triggering the 220kV bus fault (cleared at 0.1s), an electromagnetic transient program recorded real-time SVG data (reactive output, grid-connected voltage, unit speed)—following the simulation process outlined in the file. Key findings included (matching the file’s simulation results):
- Under small load (300,000 kW), low PV output (20%), and SVG constant voltage control: unattenuated low-frequency oscillations occurred post-fault, indicating high SSR risk;
- Under the same grid conditions, switching SVG to constant reactive power control: oscillations subsided within 2s, demonstrating the critical role of SVG control modes in mitigating SSR, as emphasized in the file’s risk analysis.
III. Key Findings on SVG-Related SSR Risks
Analysis of simulation results clarified SSR risk distribution and identified SVG-specific influence laws, providing a data-driven basis for risk mitigation—consistent with the file’s conclusion-drawing logic.
1. High-Risk Operating Conditions for SVG-Induced SSR
Simulation results show that the operating conditions with sub-synchronous oscillation risks in the regional power grid are concentrated in the "750kV channel and 220kV channel double-line maintenance mode"—a scenario that weakens the grid structure and amplifies SVG-PV interaction, as the file’s core risk conclusion points out. For example (consistent with the file’s case analysis):
- With 2 hydropower units, 300,000 kW load, 20% PV output, and SVG constant voltage control: the SSR risk spiked during key channel maintenance;
- Switching to SVG constant reactive power control reduced risk to compliant levels, highlighting mode selection as a critical mitigation tool, as stated in the file.
2. Influence Factors of SVG-Induced SSR
- SVG Control Modes & Parameters: Constant reactive power control posed a lower SSR risk than constant voltage control. Slower SVG response speed (larger integral time constant) also reduced risk, as it avoids resonance between SVG adjustment and grid natural frequency—directly reflecting the file’s analysis of SVG parameter influence on risks.
- PV Integration: Larger PV grid-connection scale and lower PV output (e.g., 20%) increased SSR risk, due to heightened conflicts between PV inverter control and SVG adjustment—consistent with the file’s research on PV-SVG interaction effects.
- Load Level: Higher regional load (e.g., 530,000 kW) reduced SSR risk by increasing grid equivalent damping, which absorbs oscillation energy from SVG-PV interaction—matching the file’s conclusion on load level’s buffer role.
IV. SVG-Focused SSR Mitigation Recommendations
To ensure safe SVG commissioning, mitigation measures were tailored to SVG operation and grid management, addressing identified risk factors directly—fully aligning with the file’s risk control suggestions.
1. Optimize SVG Control Strategies
- Mandate SVG constant reactive power control during 750kV/220kV key channel maintenance—when SSR risk is highest, as the file strongly recommends;
- Set SVG to "slow response" (e.g., integral time constant Ti=0.1, proportional coefficient Kp=0.5) to avoid frequency coupling, with dynamic parameter adjustments based on real-time load/PV output—consistent with the file’s SVG parameter optimization guidance.
2. Strengthen Operation & Maintenance for SVG-Integrated Grids
- Increase monitoring frequency of SVG output, grid-connected voltage/current during high-risk periods: winter peak load (SVG full operation), low PV output, and key channel maintenance—following the file’s O&M monitoring requirements;
- Require PV plants to optimize inverter inner/outer loop parameters to minimize SVG-PV control conflicts, as suggested in the file;
- Limit individual PV plant capacity during initial SVG commissioning, gradually increasing it to monitor system response—adhering to the file’s phased commissioning advice.
V. Conclusion: SVG as a Grid Enabler—With SSR Risk Controlled by Simulation
While the planned ±52Mvar SVGs will enhance regional grid transmission capacity and address load gaps, simulation confirms that mismatched SVG control modes/parameters and grid conditions can induce SSR—consistent with the file’s core warning. This research, based on the content of the file, demonstrates how transient electromagnetic simulation can:
- Identify SVG-related SSR risks in advance;
- Quantify the impact of SVG control strategies;
- Develop targeted mitigation measures.
These insights not only support safe SVG commissioning in the studied region but also provide a replicable framework for other grids with high new energy penetration and SVG integration—exactly the application value highlighted in the file. By prioritizing SVG modeling accuracy and simulation-driven risk management, SVGs can truly serve as a "booster" for stable, efficient grid operation—contributing to the construction of a new-type power system, as the file concludes.
Struggling with PV-SVG interaction issues or SSR risks in your grid? Hengrong Electric CO., LTD. excels in PV-SVG collaborative management—leave your grid scale and PV integration ratio, and we’ll tailor solutions!